Defra calculate self-sufficiency as a ratio which they call the Self Sufficiency Ratio. This is also referred to as the Food Production to Supply Ratio. I will describe the three different figures that are quoted for self-sufficiency and will distinguish between them.
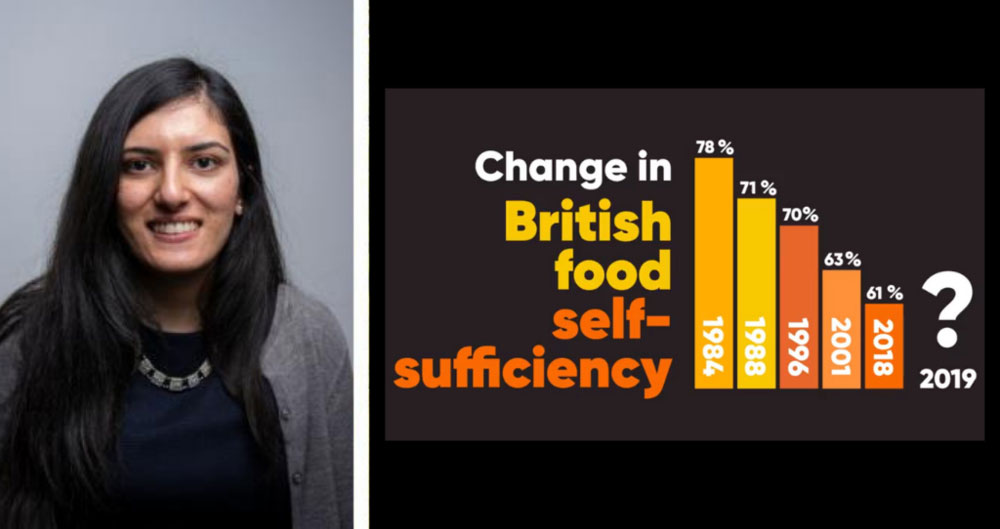
The self-sufficiency figure that you often see quoted is the self-sufficiency ratio for the UK for all food. The latest figures estimate this to be 61% for all food in 2018. This essentially means that the UK grows 61% of the food it eats and includes exported food.
It is calculated as the farmgate value of raw food production divided by the value of raw food for human consumption. So, in simple terms, the calculation is production over consumption as a percentage.
The other figure you may have come across is the self-sufficiency ratio - not for all food, but indigenous type foods.
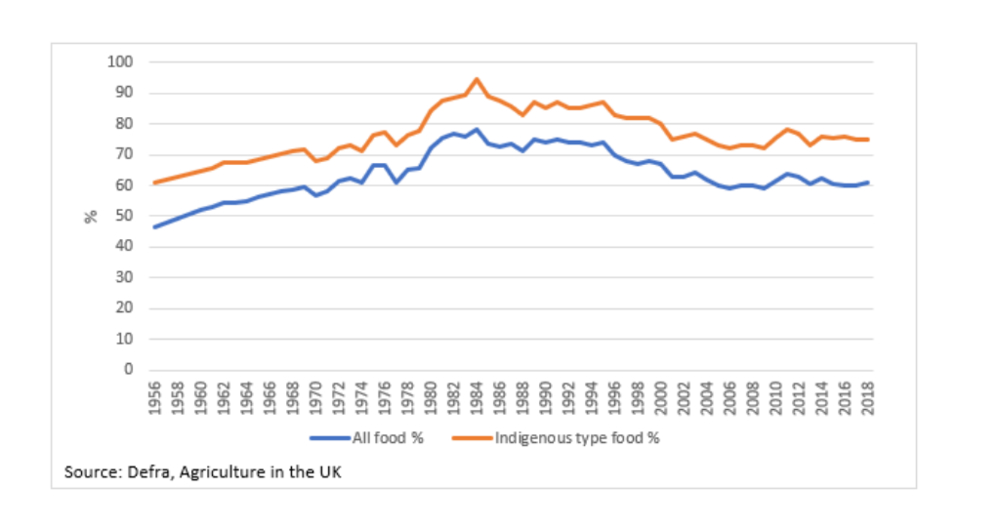
This was 75% in 2018. This is basically food that can be produced within the climatic conditions of the UK. The 75% figure excludes non-indigenous items such as exotic fruit – bananas, mangoes, tea, coffee and spices – foods that cannot be grown (either at all or on a meaningful scale) in the UK. Self-sufficiency for all food and indigenous foods peaked in 1984 at 78% and 95% respectively. And roughly over the past 30 years, the UK's self-sufficiency in foods has been steadily declining (see graph below).

Above: Self-sufficiency (food production to supply ratio)
If things couldn't get more confusing, as I mentioned, there is a third figure added to the mix. This is referred to as the origins of food consumed in the UK and was 53% in 2018.
It means the UK supplied just over half of the food consumed in the UK. This differs to the self-sufficiency ratio that I described above. The UK origin figure consists of UK domestic production minus UK exports.
The idea behind this figure is that sourcing food from a diverse range of stable regions, in addition to domestically, enhances food security such as imports making up for domestic supply shortages. The self-sufficiency ratio on the other hand, is not an appropriate measure of 'food security' since it fails to take account for many dimensions of this complex issue.
This is one of the important ways that the self-sufficiency figures differ from the origins of food consumed in the UK. For instance, a high self-sufficiency ratio (food production to supply ratio) fails to insulate a country against many possible disruptions to its supply chain.
Therefore, a high self-sufficiency ratio (food production to supply ratio) does not necessarily improve food security because of the possibility of domestic supply variability as a result of changes in the weather and disease risk.
The Self Sufficiency Ratio (also referred to as Food Production to Supply Ratio) for the UK is calculated as the farmgate value of raw food production divided by the value of raw food for human consumption. This is estimated to be 61% for all food in 2018.
Read our member briefing for a breakdown of the figures by sector and what they mean to British farming.
This briefing is available to NFU members only and you will be asked to log in.
How to log in: Use your membership number or the email address associated with your membership to log in. If you've forgotten your password, you can click here to reset it or contact NFU CallFirst on 0370 845 8458.
Read more:
